


 14 / 36

14
/
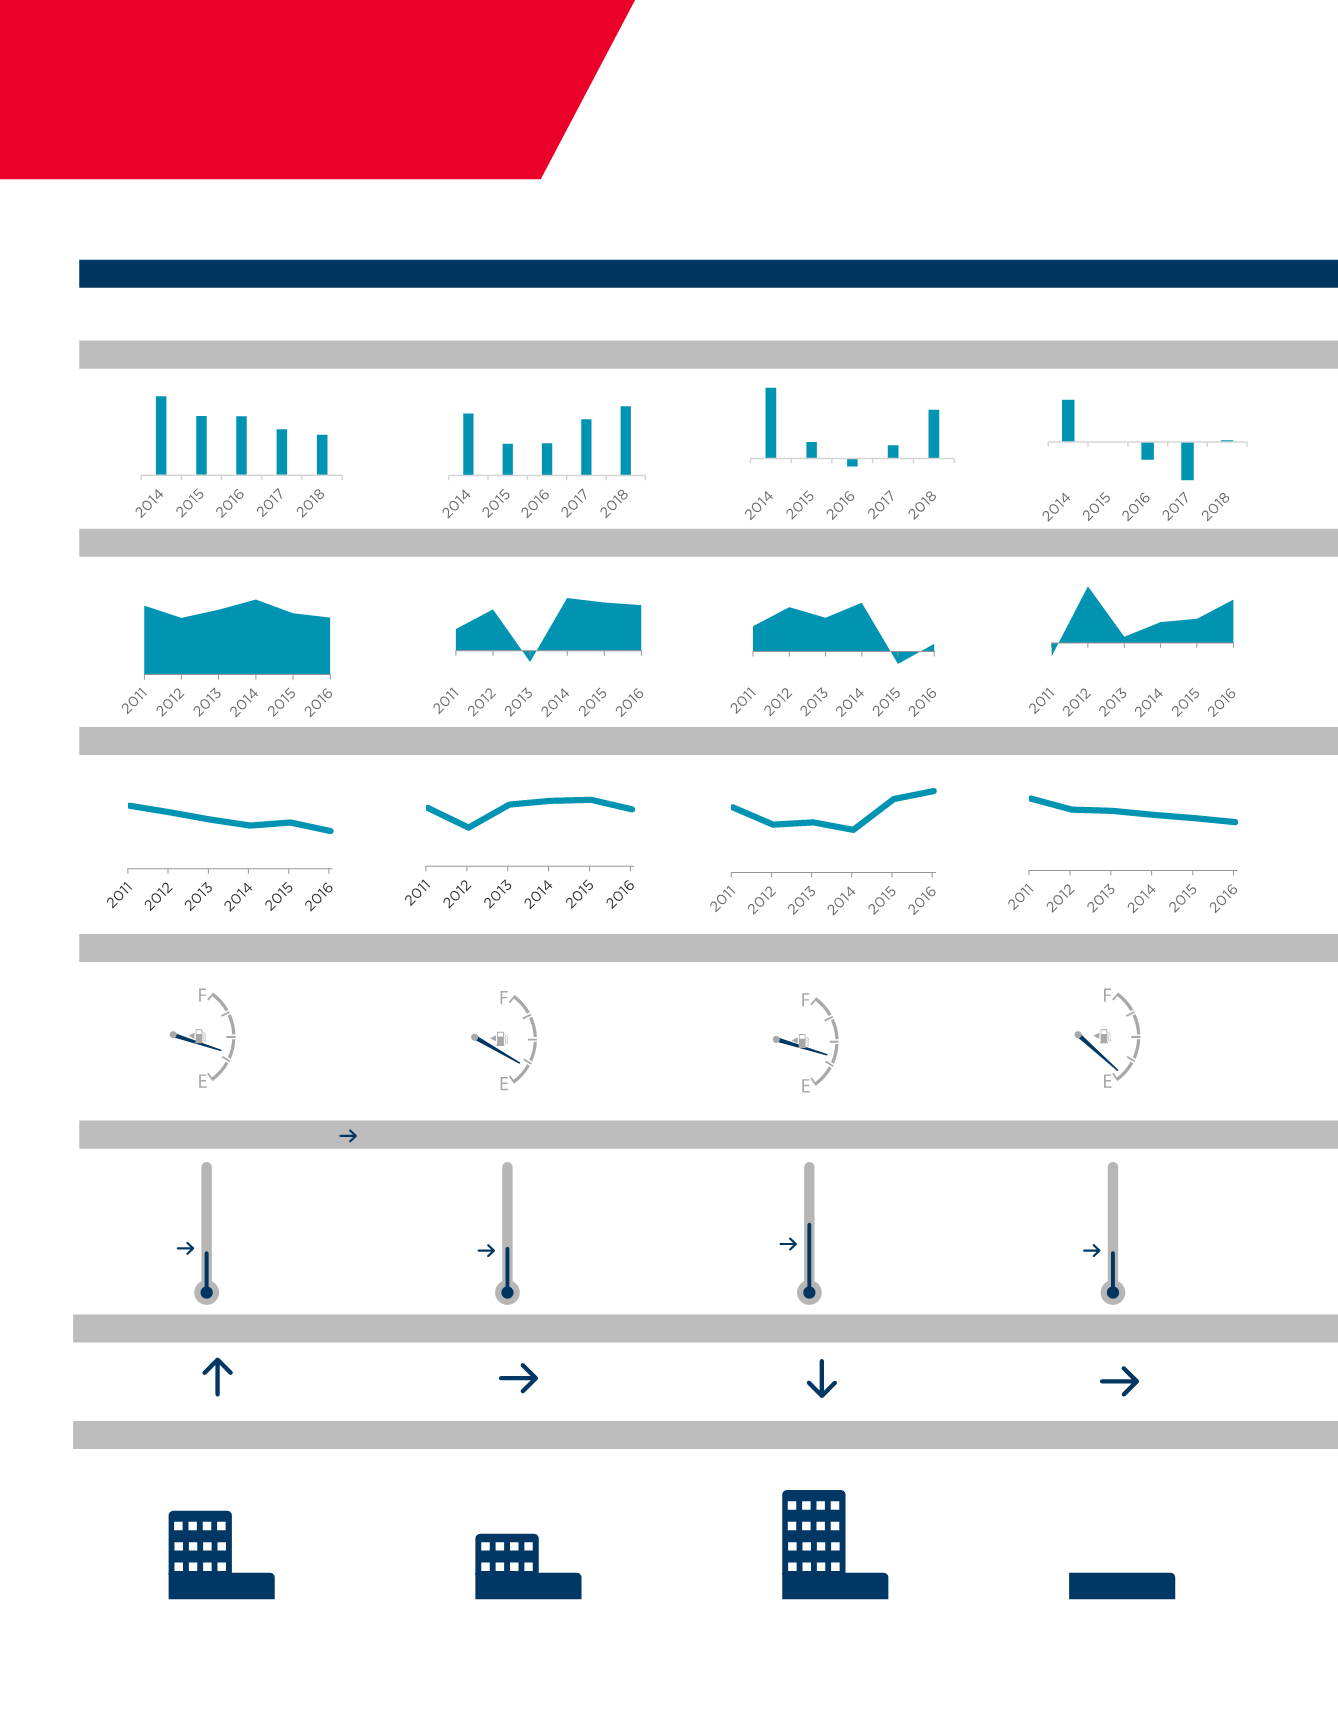
Oil: The Commodity We Love to Hate
DENVER
HOUSTON
FORT WORTH
NEW ORLEANS
MARKETS
MARKET INDICATORS
Office Absorption
Landlord/Tenant (Q2 16) ( 5 year average availability ratio)
Pipeline (Completions - Q2 16 - Q4 18)
Rent Growth Forecast (Q2 16 - Q2 17)
Rent Growth (Q2 15 - Q2 16)
Office Vacancy
Job Growth
0%
5%
10%
15%
20%
0%
5%
10%
15%
20%
0%
5%
10%
15%
20%
0%
5%
10%
15%
20%
15%
20%
25%
30%
5%
10%
15%
20%
25%
30%
5%
10%
15%
20%
25%
30%
5%
10%
15%
20%
25%
30%
5%
10%
Source: Moody’s, U.S. Bureau of Labor Statistics, Cushman & Wakefield Research
773,109 sq ft
1,393,114 sq ft
9,127,548 sq ft
31,308 sq ft
UNITED STATES
5%
10%
15%
20%
5%
10%
15%
5%
10%
15%
20%
5%
10%
15%
0
20
40
60
Thousand people
0
10
20
30
40
Thousand people
0.0
0.5
1.0
1.5
2.0
2.5
Million sq ft
-0.2
0.0
0.2
0.4
0.6
Million sq ft
-2.0
0.0
2.0
4.0
6.0
Million sq ft
-0.2
-0.1
0.0
0.1
0.2
0.3
0.4
Million sq ft
-30
20
70
120
Thousand people
-10
-5
0
5
10
15
Thousand people