


 12 / 36

12
/
Oil: The Commodity We Love to Hate
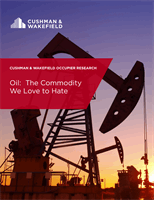
Houston
Fort Worth
16%
Pittsburgh
6%
17%
New Orleans
8.5%
Total
Employment
Growth
Ranking
(# Jobs)*
Total
Employment
Growth
Ranking
(% Change)*
Vacancy Rate
Ranking
(65 top cities)
Q2 14
Rent Growth
Ranking
(65 top cities)
Q1 09 - Q2 14
Denver
13
27
25
29
Fort Worth
23
41
28
12
Houston
2
16
20
19
New Orleans
48
126
14
16
North Dakota
25
4
2
13
Oklahoma City
36
63
26
25
Pittsburgh
41
227
5
20
San Antonio
22
24
39
15
Tulsa
69
180
45
10
Top Energy Markets - Oil Price Boom
Top Energy Markets - Oil Price Correction
13.9% of global
oil production
comes from the
United States.
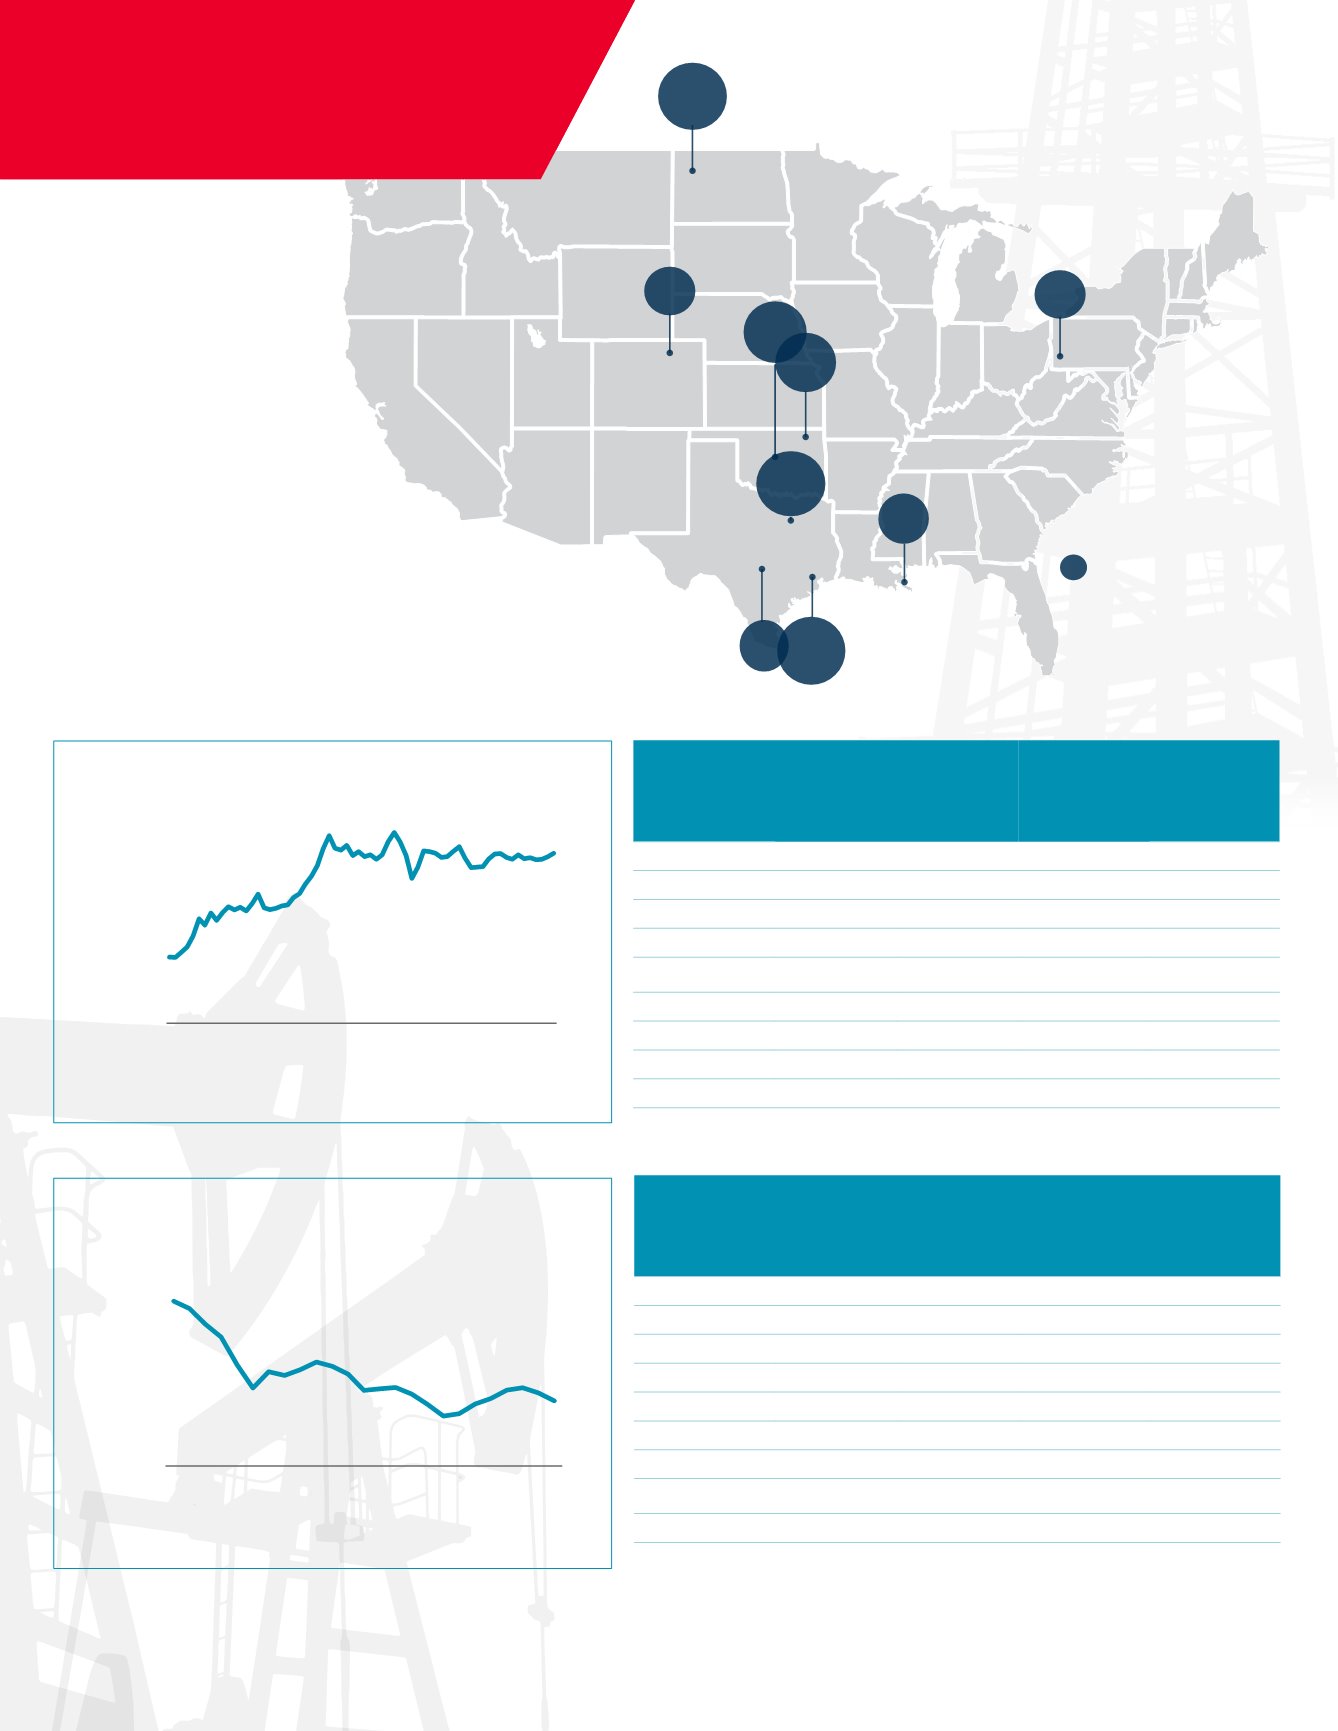
OIL PRICES: WHERE THEY WERE
San Antonio
5%
Oklahoma City
13%
Tulsa
14%
Denver
6%
Size of bubble represents
energy sector contribution to
total city GDP
Source: Oxford Economics, BP, Moody’s Analytics, Cushman & Wakefield Research
Total
Employment
Growth
Ranking
(# Jobs)*
Total
Employment
Growth
Ranking
(% Change)*
Vacancy Rate
Ranking
(65 top cities)
Q2 16
Rent Growth
Ranking
(65 top cities)
Q2 14 - Q2 16
Denver
12
39
24
16
Fort Worth
38
203
28
30
Houston
84
315
57
10
New Orleans
132
286
19
49
North Dakota
390
386
3
34
Oklahoma City
139
298
53
27
Pittsburgh
387
347
12
65
San Antonio
33
33
45
38
Tulsa
386
362
58
62
*(390 Cities) 06/30/15-06/30/16
Source: U.S. Bureau of Labor Statistics, CoStar, Cushman & Wakefield Research
Source: EIA, Cushman & Wakefield Research
UNITED STATES
North Dakota
13.3%
OIL PRICES: WHERE THEY ARE
*(390 Cities) 2009-2014
$0
$20
$40
$60
$80
$100
$120
Aug-14
Oct-14
Dec-14
Feb-15
Apr-15
Jun-15
Aug-15
Oct-15
Dec-15
Feb-16
Apr-16
Jun-16
Aug-16
$ per barrel (Brent)
$0
$20
$40
$60
$80
$100
$120
Jan-09
Jun-09
Nov-09
Apr-10
Sep-10
Feb-11
Jul-11
Dec-11
May-12
Oct-12
Mar-13
Aug-13
Jan-14
Jun-14
$ per barrel (Brent)