


 17 / 36

Cushman & Wakefield
/
17
Energy-producing provinces feel the pinch
Canada’s mighty resource sector accounts for almost one-fifth of
the country’s GDP and about 1.8 million jobs. Ranked fifth in the
world in oil production, Canada produces 3.9 million bpd, 97% of
which is from Alberta, Manitoba, and Newfoundland and Labrador.
Alberta is the leading producer, responsible for almost 80% of the
country’s total output. Not surprisingly, the oil shock and sustained
low prices have weighed heavily on the most exposed office
markets of Calgary, Edmonton, and St. John’s.
Taking a heavy toll on Alberta
Calgary is home to most of Canada’s heavyweight oil and gas
companies, including EnCana, Husky Energy, and Suncor Energy.
Since late 2014, roughly 46,000 jobs have been eliminated in
Alberta due to the oil shock, and Calgary’s CBD office sector
has seen 4.3 msf of space returned to the market. Prior to the
oil price bust, Calgary boasted the highest 15-year CBD office
growth rate in the country, with 750,000 sq ft absorbed per year.
With 2.7 msf of new developments underway, the availability rate
in Calgary’s premium class A CBD buildings is projected to reach
around 27.5% by late 2017.
While Edmonton’s CBD office market has the advantage of few
significant oil tenancies, energy continues to be a key driver of
the city’s economy. Government is a major occupier of space,
and both the federal and provincial levels have been grappling
with serious shortfalls in oil and gas tax revenues since late 2014.
Against weak demand and 1.7 msf of new development in the
CBD, availability is projected to register 21.2% by Q4 2018.
St. John’s—Weathering the storm
Three billion barrels of oil and 11 trillion cubic feet of natural
gas have been discovered in Newfoundland and Labrador,
and 200,000 bpd is currently being produced from offshore
projects Hibernia, Terra Nova, and White Rose, with Hebron
under development. The economic contraction that impacted
the St. John’s office market in 2015 was due to both a 20%
drop in oil production and lower oil prices. While its CBD office
market has seen a huge slowdown in momentum, most energy
tenants are service-related, and a large proportion of them have
recently renewed their space commitments — a event which will
stabilize this market. The desire for quality space has kept Class A
availability at 8.8%, although space returning to market will push
it to 19.8% by Q4 2017.
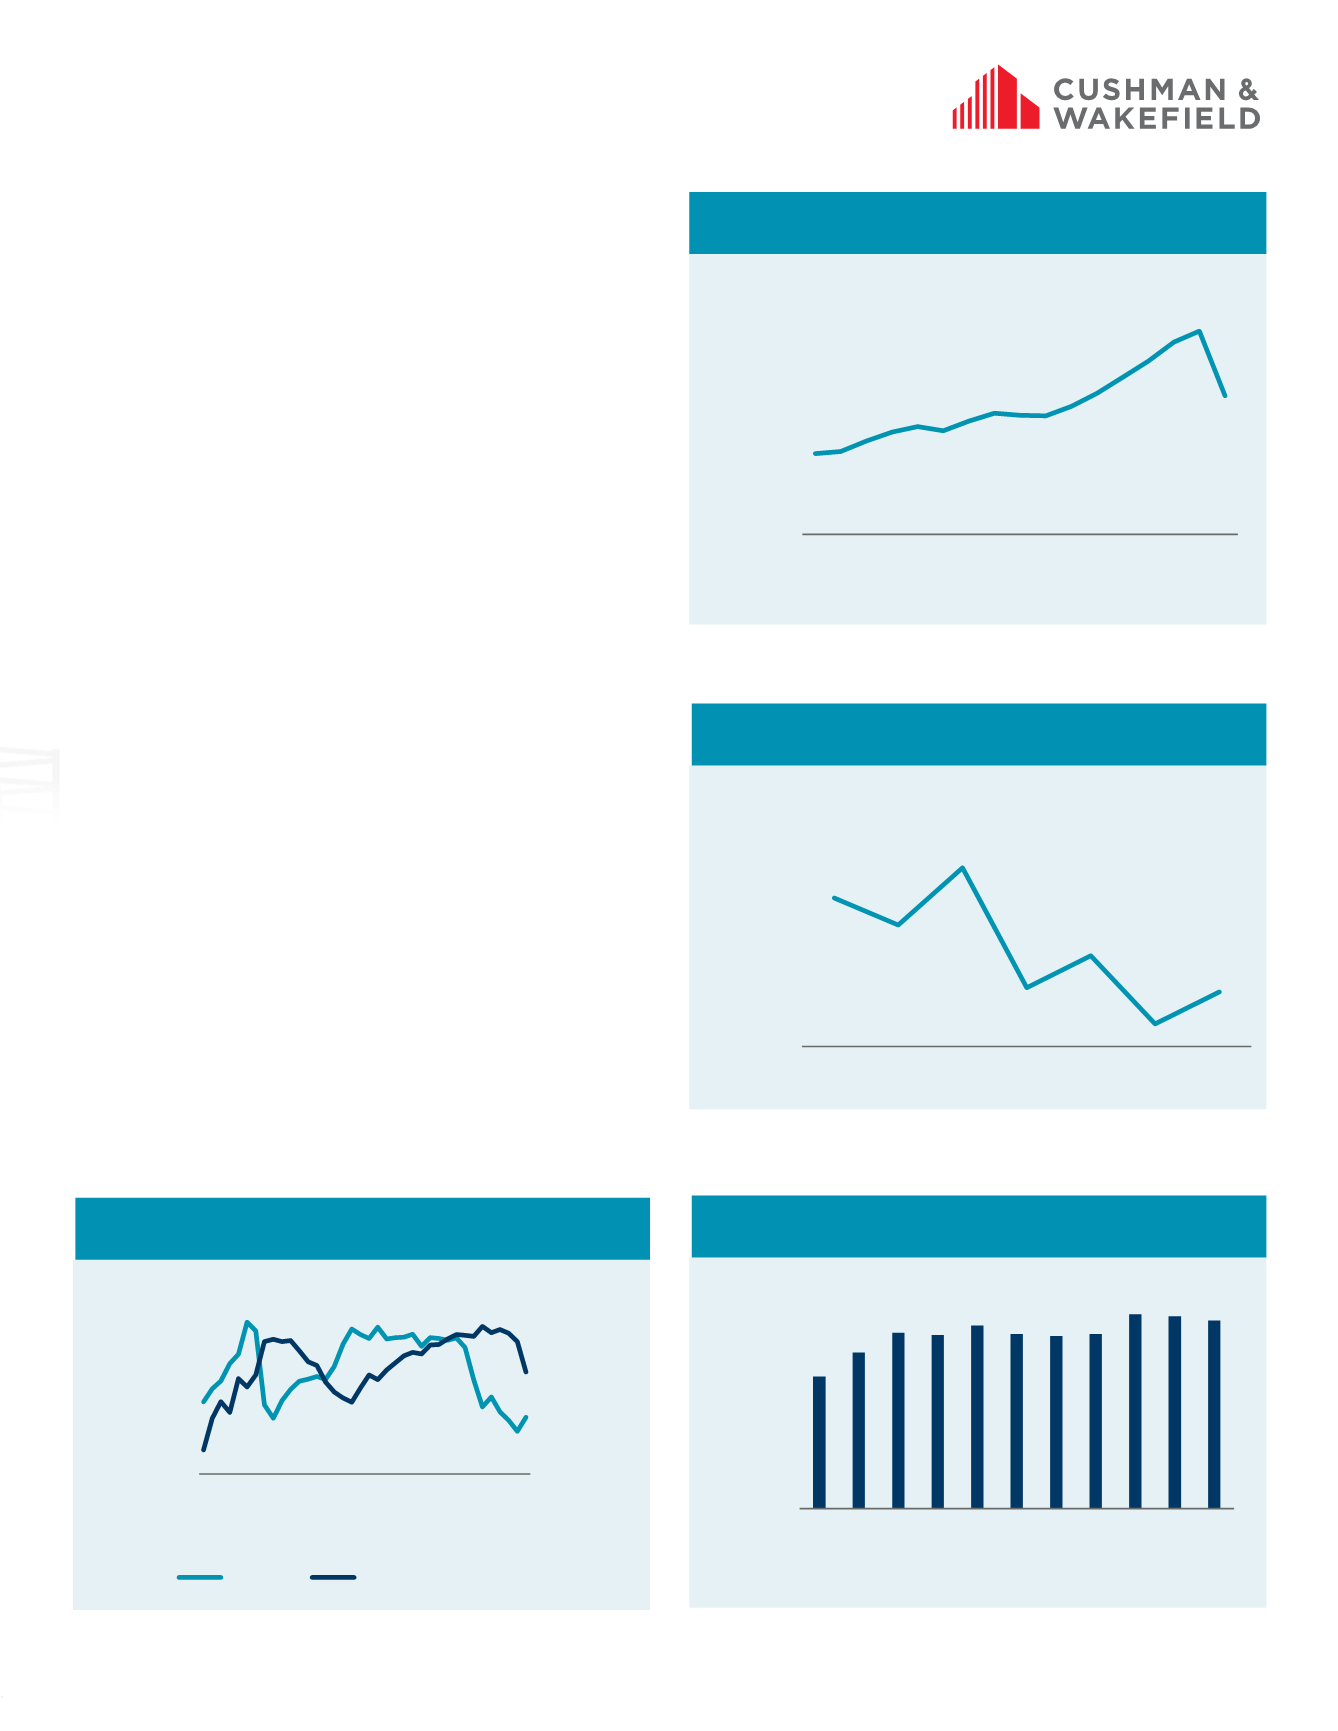
CANADIAN OIL PRODUCTION
Source: National Energy Board, Cushman & Wakefield Research
CANADIAN GAS PRICE
Source: National Energy Board, Cushman & Wakefield Research
CANADIAN EMPLOYMENT - OIL, GAS, &
PIPELINE SECTORS
Source: Statistics Canada, Cushman & Wakefield Research
OIL PRICE VS. CANADIAN RENT CORRELATION
Source: EIA, Cushman & Wakefield Research
$1.00
$1.10
$1.20
$1.30
$1.40
$1.50
Q2 13 Q4 13 Q2 14 Q4 14 Q2 15 Q4 15 Q2 16
$ CDN per liter
0
50
100
150
200
2005
2006
2007
2008
2009
2010
2011
2012
2013
2014
2015
Thousand people
$14
$15
$16
$17
$18
$19
$20
$0
$20
$40
$60
$80
$100
$120
$140
2007
2008
2009
2010
2011
2012
2013
2014
2015
Q2-2016
sq ft per yr
$ per barrel (Brent)
Oil Price
Overall Office Rent
1,000
1,500
2,000
2,500
3,000
3,500
4,000
4,500
2000
2002
2004
2006
2008
2010
2012
2014
May-16
Millions of bpd