


 13 / 36

Cushman & Wakefield
/
13
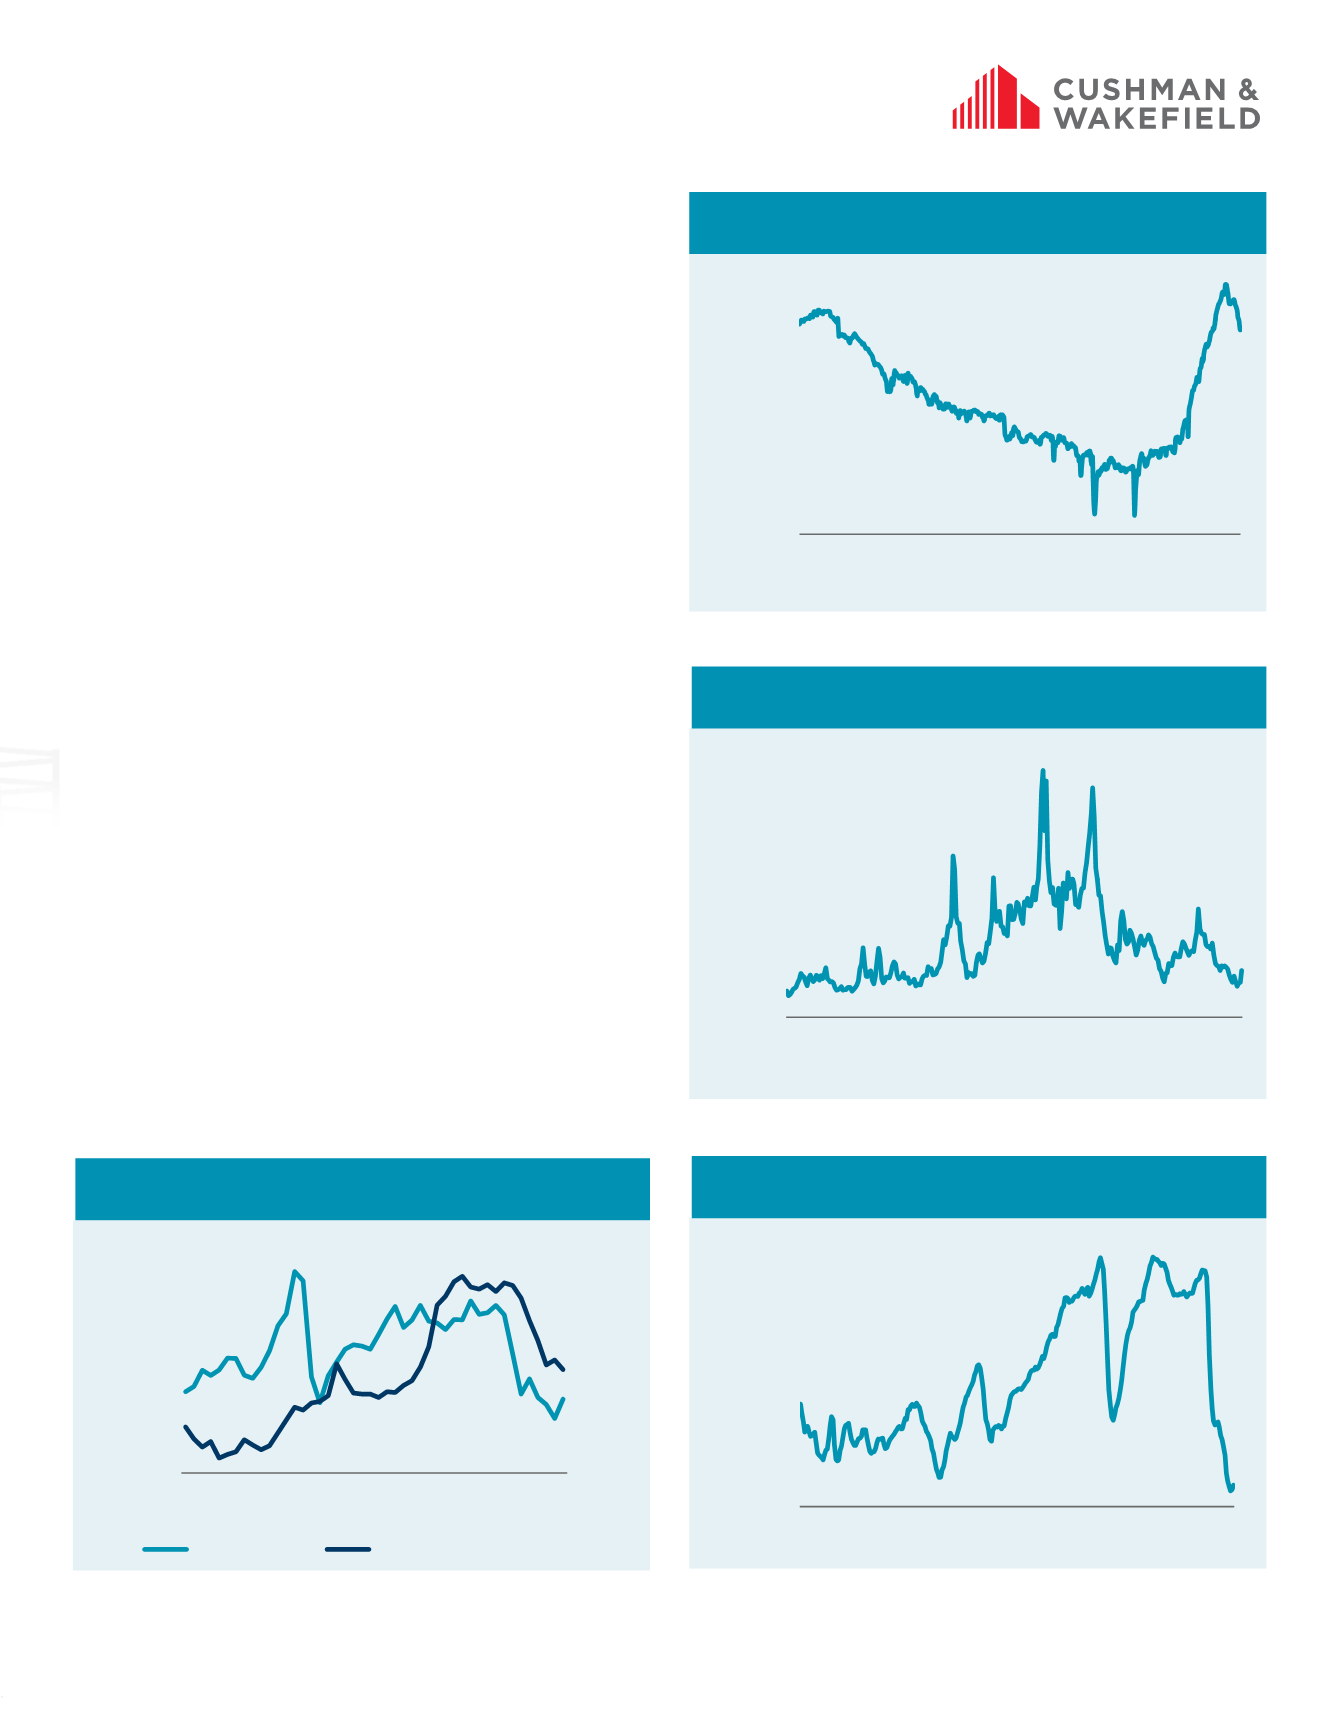
The world’s largest consumer
The United States has been the world’s largest oil consumer
for decades. It currently consumes roughly 19.4 million bpd.
As recently as 2008, two-thirds of that demand was met by
imports. However, since then, the U.S. has seen a production
surge as hydraulic fracturing technology allowed producers to
tap into shale oil reserves and nearly double domestic output.
While recent oil price declines have led to lower output, U.S. oil
production remains near record highs.
Clustered in Southwest
The U.S. oil industry is concentrated in the Southwest part of the
country — along the Gulf of Mexico coast from Louisiana to Texas,
and north from Texas into Oklahoma. As these regions became
centers for production, imports and refining, cities in the area —
led by Houston, Texas and Oklahoma City, Oklahoma — became
the major oil centers in the U.S. The energy industry accounts
for between 13% and 17% of all economic activity in each of
these cities. In addition, the shale oil revolution has generated oil
booms in areas near large shale deposits, such as Denver, North
Dakota and Pittsburgh.
Boom times during price surge; slowdown since 2014
During the production surge of 2009 to 2014, U.S. oil centers
were among the best-performing office markets in the nation.
In five of the top ten job growth cities in the nation in that
timeframe, energy played a major role, and those markets
experienced strong absorption of space, declining vacancy rates,
and rising rents. They also saw building booms — by mid-2014,
buildings under construction in those U.S. oil centers accounted
for 2.8% of inventory, double the 1.4% national average. In
Houston, new construction accounted for more than 5% of
U.S. inventory. But as oil prices began to fall, these markets felt
the impact as that new, “production-surge” construction was
delivered and demand slowed. Today, oil-centric markets in the
U.S. register some of the highest vacancy rates in the nation.
Office markets in energy-centric metros with more diverse
economies — Dallas and Denver — have held up much better.
U.S. OIL PRODUCTION
Source EIA, Cushman & Wakefield Research
U.S. NATURAL GAS PRICE
Source: International Monetary Fund, Cushman & Wakefield Research
RIG COUNT
Source: Baker Hughes, Cushman & Wakefield Research
OIL PRICE VS. OIL CITY VACANCY RATIO
Note: Vacancy Ratio is U.S. vacancy/oil city vacancy. A rising ratio means that oil
cities are doing better than the U.S. as a whole
Source: EIA, Cushman & Wakefield Research
75%
80%
85%
90%
95%
100%
105%
110%
115%
$0
$20
$40
$60
$80
$100
$120
$140
2005
2006
2007
2008
2009
2010
2011
2012
2013
2014
2015
2016
$ per barrel (Brent)
Oil Price
Rent Ratio: US/Oil Cities
3,500
4,500
5,500
6,500
7,500
8,500
9,500
1984
1988
1992
1996
2000
2004
2008
2012
2016
Thousands of bpd
$0
$2
$4
$6
$8
$10
$12
$14
1992
1994
1997
2000
2002
2005
2008
2010
2013
2016
$ per thousand BTUs
300
500
700
900
1,100
1,300
1,500
1,700
1,900
2,100
1991
1996
2001
2006
2011
2016
Number of rigs