


 8 / 36

8
/
Oil: The Commodity We Love to Hate
GLOBAL OVERVIEW
Outside of these hardest hit markets, most of the energy cities
have more diverse economies, and are therefore performing
much like other healthy office markets around the world. For
example, Denver, CO is an oil-centric city but it also has many
thriving industries (tech, tourism, professional services). As a
result, Denver has seen its vacancy rate improve from 12.8% mid-
2014 (when oil prices were booming) to 11.4% mid-2016 (post oil
price correction). Since mid-2014, the Denver office market has
absorbed 3.6 million square feet (msf) and has seen rents grow
by 13%.
LATEST INDUSTRY DEVELOPMENTS
Oil price—Finally showing signs of firming
Over the course of the first half of 2016, Brent crude saw its price
rebound from a low of $26 per barrel in January to over $52 per
barrel at the beginning of June. Since then, oil prices have bumped
around and, as of this writing in September, were currently
hovering around $45 per barrel.
The oil market continues to be subjected to abundant supply,
an excess of refined products, and a waning outlook for the
global economy. Recent crude build in the U.S. and production
resumption in Canada and Nigeria means the re-balancing of
global oil market supply/demand is now a more distant prospect.
In July, OPEC production reached 33.2 million bpd from a revised
33.3 million bpd in June. In addition, following an agreement
between the UN-backed government and an armed force, Libya
said its state oil company would reopen oil ports in the country,
and that it would act quickly to resume exports. Libya is looking
to increase exports to 900,000 bpd by the close of 2016. Finally,
drillers have continued to add oil rigs in the U.S. As of August 12,
U.S. drillers had 481 oil rigs in production, up 17 from the prior
count but still down 403 from the same time last year.
Note: Production includes OPEC and non OPED countries. Consumption includes
OECD countries.
*Crude includes lease condensates.
Source: EIA, Cushman & Wakefield Research
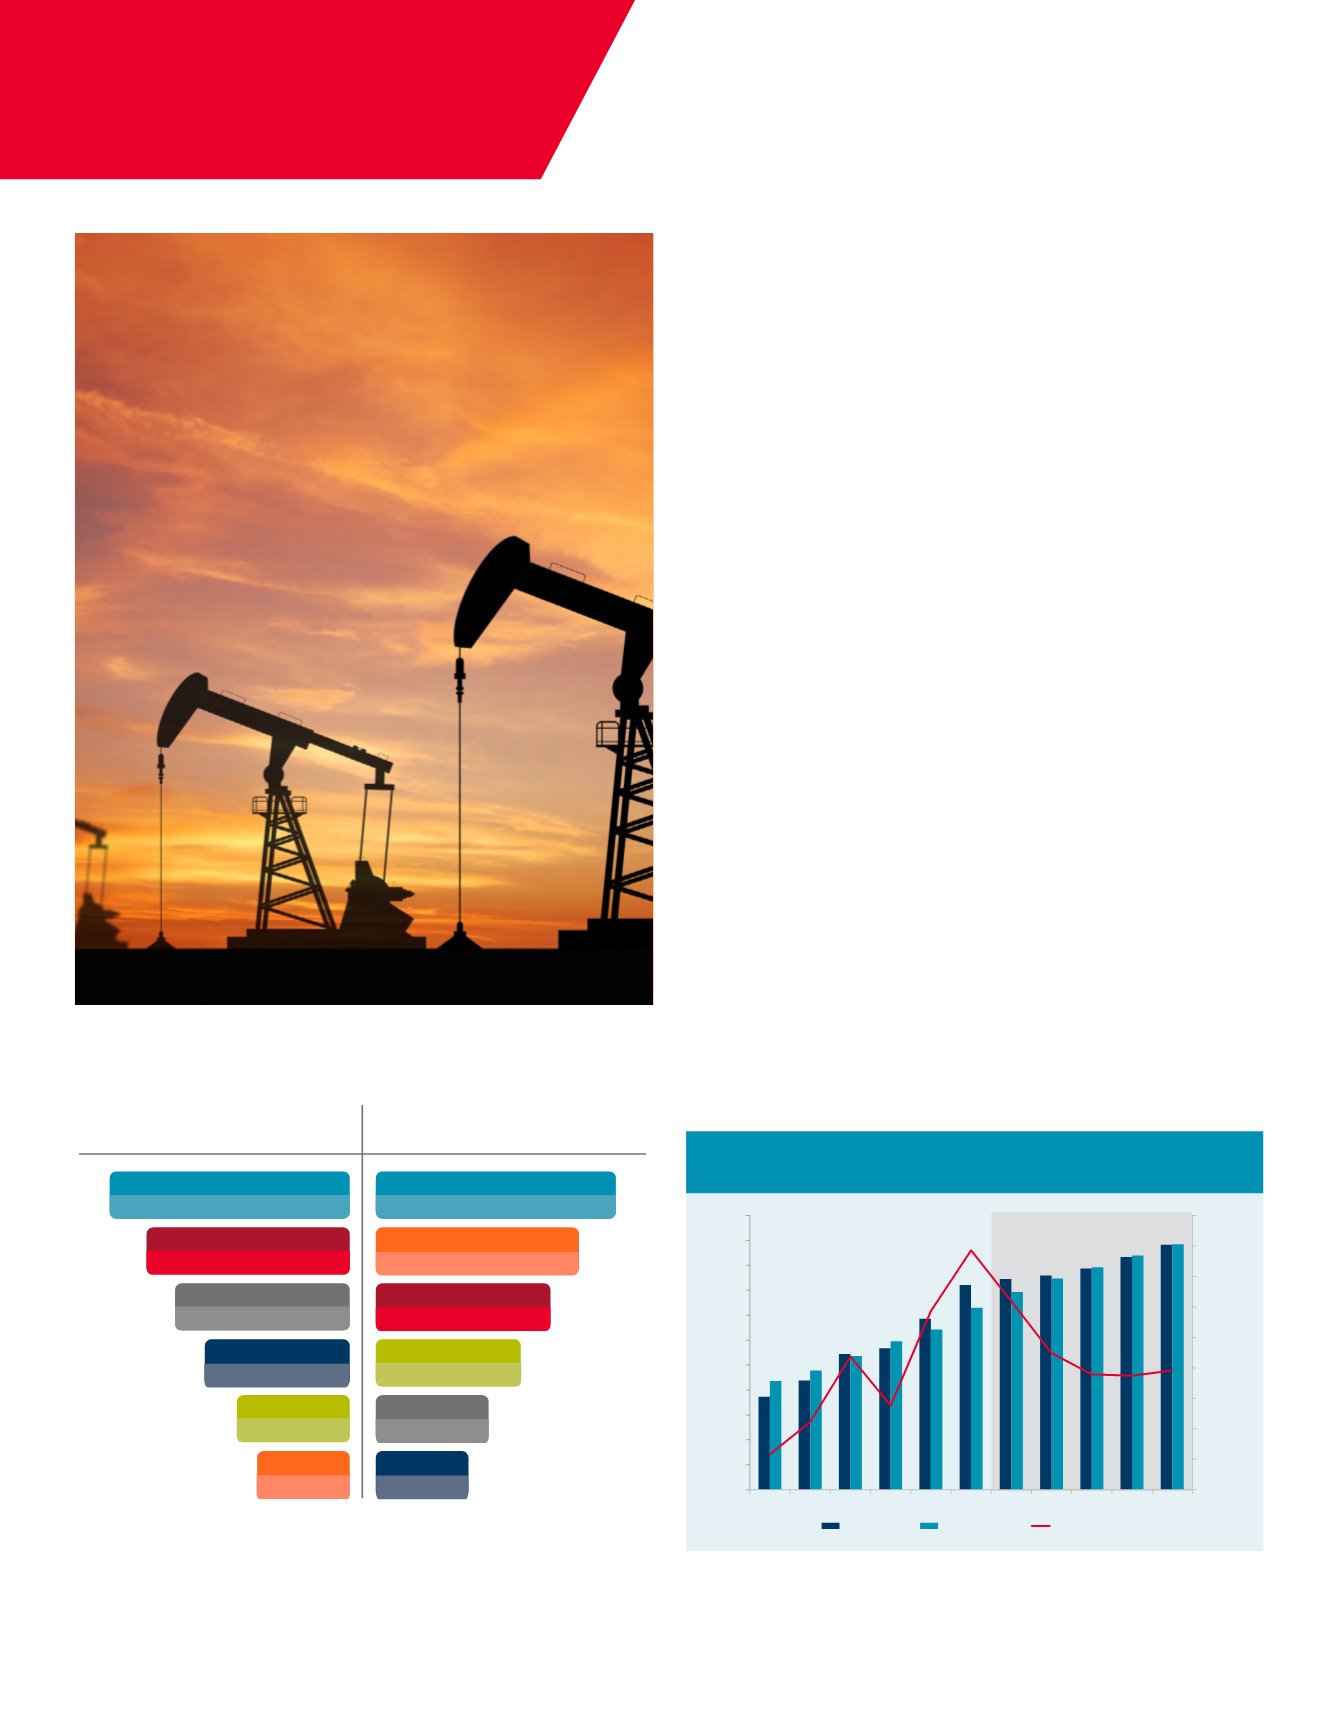
GLOBAL OIL PRODUCTION AND CONSUMPTION BY
REGION (2015/2016)
Crude Oil Production*
(Million bpd)
Petroleum Consumption
(Million bpd)
49.49
(2015)
EMEA
50.01
(2016)
15.04
(2015)
UNITED STATES
14.50
(2016)
10.94
(2015)
10.64
(2016)
LATIN AMERICA
4.72
(2015)
4.61
(2016)
CANADA
4.51
(2015)
4.57
(2016)
GREATER CHINA
4.45
(2015)
4.52
(2016)
APAC
EMEA
31.44
(2015)
31.78
(2016)
APAC
20.12
(2015)
20.69
(2016)
UNITED STATES
19.39
(2015)
19.56
(2016)
GREATER CHINA
11.28
(2015)
11.68
(2016)
LATIN AMERICA
9.27
(2015)
9.26
(2016)
CANADA
2.34
(2015)
2.31
(2016)
GLOBAL OIL PRODUCTION AND CONSUMPTION
2010 - 2020
Source: EIA, IEA, Cushman & Wakefield Research
-2.0%
-1.5%
-1.0%
-0.5%
0.0%
0.5%
1.0%
1.5%
2.0%
2.5%
80
82
84
86
88
90
92
94
96
98
100
102
2010 2011 2012 2013 2014 2015 2016 2017 2018 2019 2020
Surplus/Deficit
Million (bpd)
Production
Consumption
Surplus/Deficit
Forecast