


 24 / 36

24
/
Oil: The Commodity We Love to Hate
Employed
Population
Ranking*
Job Growth
Ranking*
Vacancy Rate
Ranking
(44 cities)
Q2 14
Rent Growth
Ranking
(44 cities)
Q1 09- Q2 14
Aberdeen
142
124
6
13
Hamburg
59
153
8
16
London
3
111
3
2
Marseille
167
191
1
7
Moscow
5
120
37
10
Oslo
119
165
9
4
Rotterdam
249
246
43
21
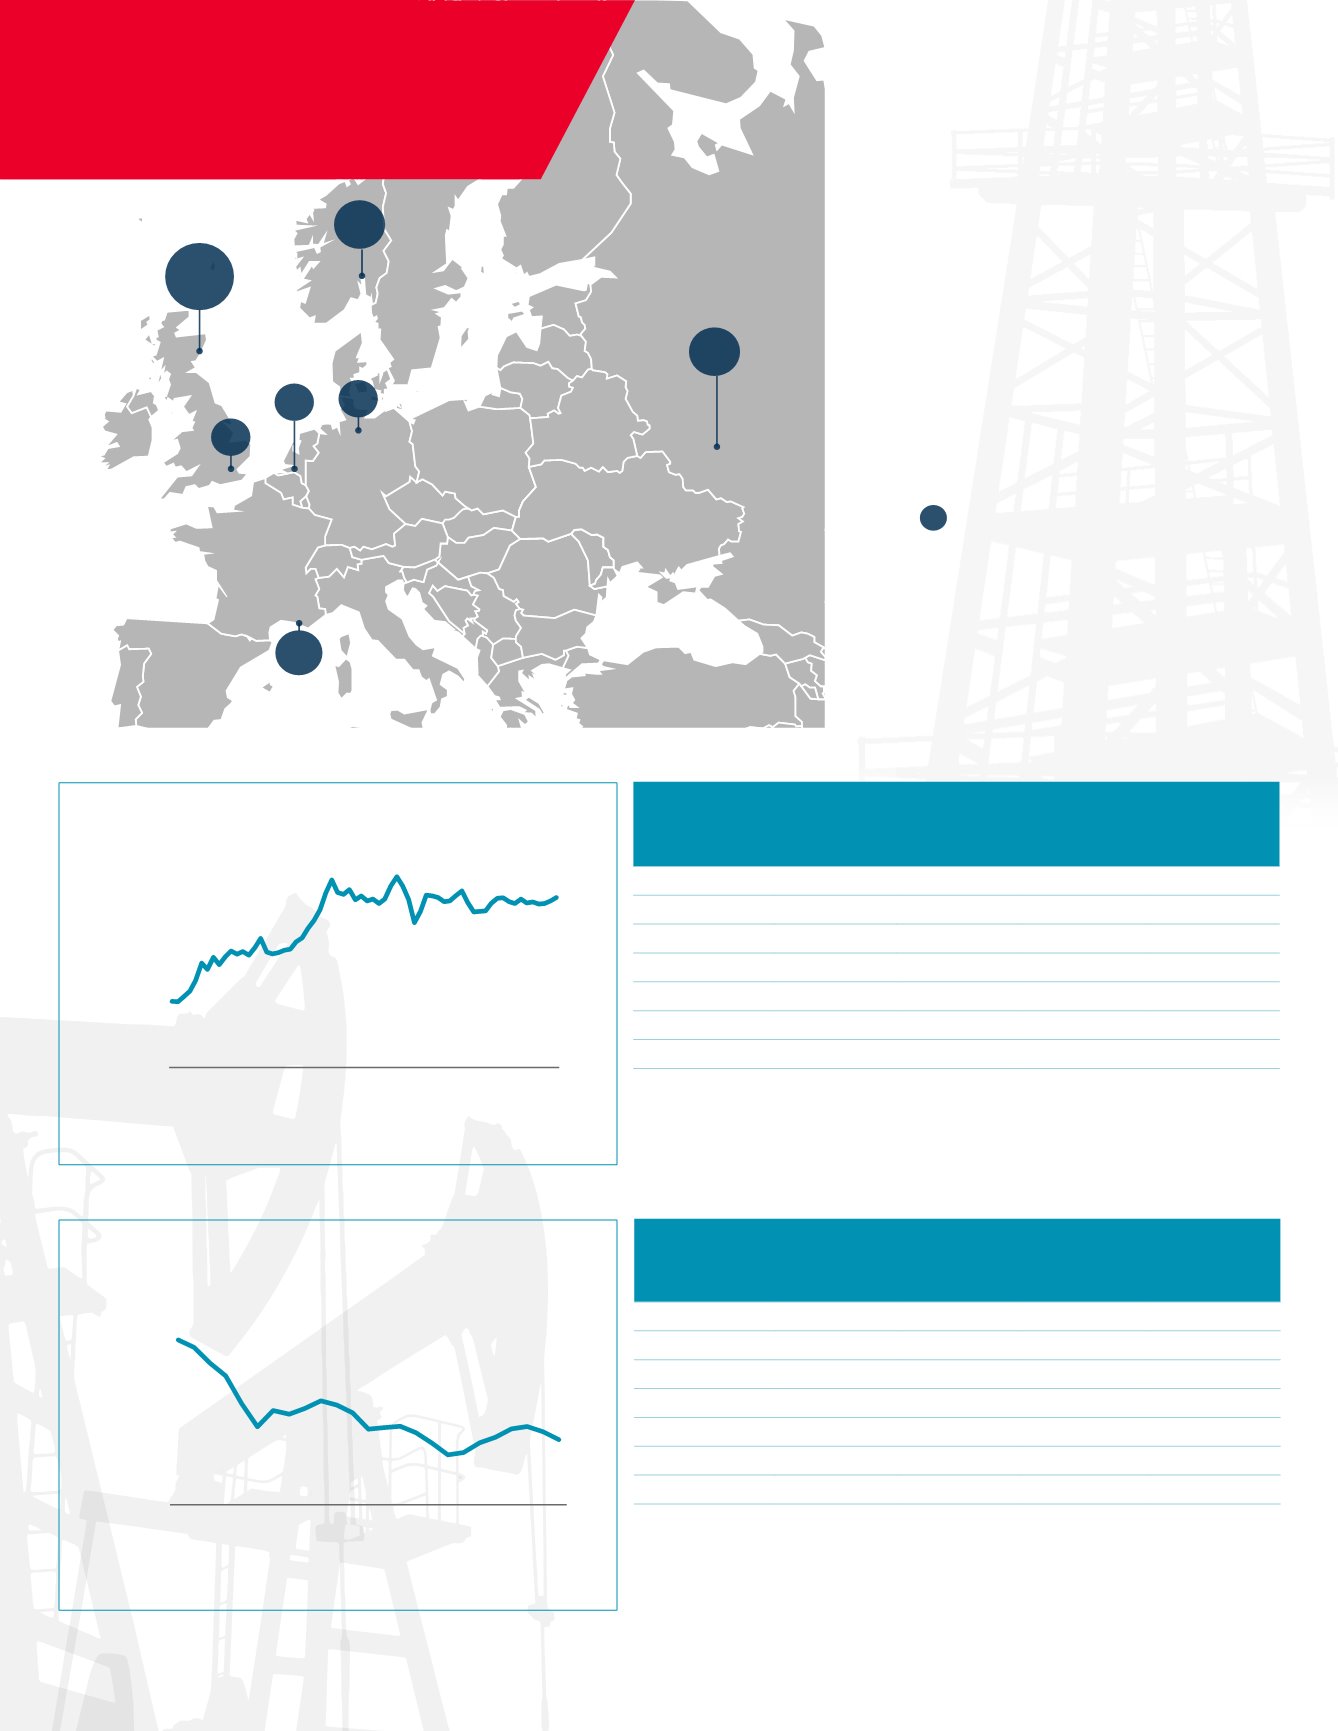
Top Energy Markets - Oil Price Boom
Top Energy Markets - Oil Price Correction
61% of global oil
production comes
from EMEA.
Size of bubble represents energy
sector contribution to total city GDP
Source: EIA, BP, OPEC, Cushman & Wakefield Research
Employed
Population
Ranking*
Job Growth
Ranking*
Vacancy Rate
Ranking
(15 top cities)
Q2 16
Rent Growth
Ranking
(44 cities)
Q2 14 - Q2 16
Aberdeen
217
210
46
44
Hamburg
92
193
9
16
London
4
130
2
6
Marseille
203
221
1
17
Moscow
279
243
42
46
Oslo
228
234
18
27
Rotterdam
145
189
43
10
*(280 Cities) 2014-2016
Source: EIA, Cushman & Wakefield Research
Aberdeen
14.1%
Source: EIA, Cushman & Wakefield Research
Oslo
3.0%
Moscow
3.1%
Marseille
2.8%
London
1.1%
Rotterdam
1.6%
Hamburg
1.8%
EMEA
OIL PRICES: WHERE THEY WERE
OIL PRICES: WHERE THEY ARE
*(280 Cities) 2009-2014
$0
$20
$40
$60
$80
$100
$120
Aug-14
Oct-14
Dec-14
Feb-15
Apr-15
Jun-15
Aug-15
Oct-15
Dec-15
Feb-16
Apr-16
Jun-16
Aug-16
$ per barrel (Brent)
$0
$20
$40
$60
$80
$100
$120
Jan-09
Jun-09
Nov-09
Apr-10
Sep-10
Feb-11
Jul-11
Dec-11
May-12
Oct-12
Mar-13
Aug-13
Jan-14
Jun-14
$ per barrel (Brent)