


 28 / 36

28
/
Oil: The Commodity We Love to Hate
Employed
Population
Ranking*
Job Growth
Ranking*
Vacancy Rate
Ranking
(5 cities)
Q2 14
Rent Growth
Ranking
(5 cities)
Q1 09 - Q2 14
Mumbai
1
5
5
5
Kuala Lumpur
7
1
4
2
Singapore
4
2
1
4
Jakarta
3
6
2
1
Perth
11
4
3
3
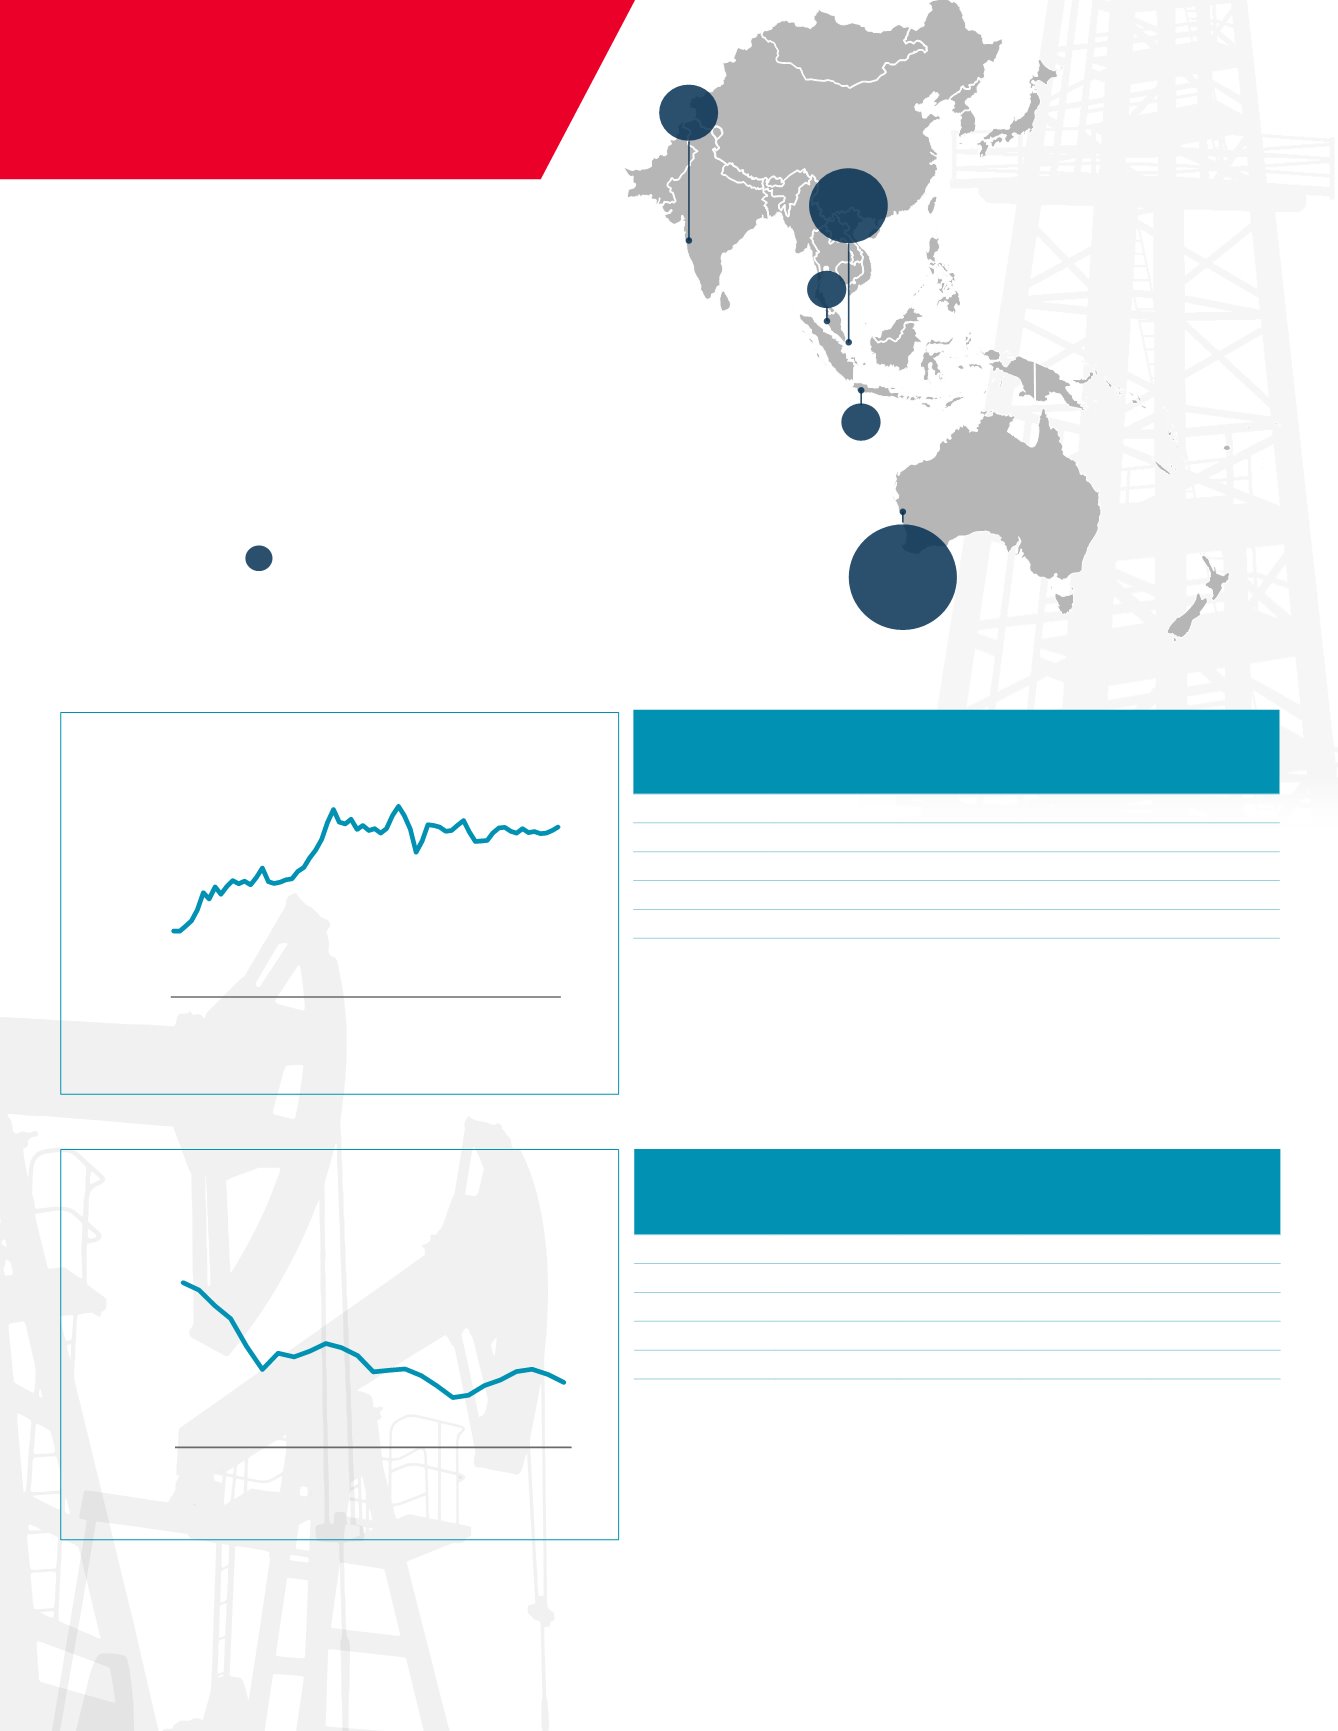
Top Energy Markets - Oil Price Boom
Top Energy Markets - Oil Price Correction
4.4% of global oil
production comes
from APAC
Size of bubble represents energy
sector contribution to total city GDP
Note: APAC excluding Greater China
Source: EIA, BP, National Statistics Bureaus, Cushman & Wakefield Research
Employed
Population
Ranking *
Job Growth
Ranking*
Vacancy Rate
Ranking
(5 cities)
Q2 16
Rent Growth
Ranking
(5 cities)
Q2 14 - Q2 16
Mumbai
1
1
3
1
Kuala Lumpur
13
7
4
3
Singapore
2
4
1
4
Jakarta
12
3
5
2
Perth
11
11
2
5
*(14 Cities) 01/01/14-12/31/14
Source: Oxford Economics, Cushman & Wakefield Research
Perth
30.1%
APAC
Jakarta
1.2%
Kuala Lumpur
1.5%
Singapore
11.9%
Mumbai
7.1%
Source: EIA, Cushman & Wakefield Research
OIL PRICES: WHERE THEY WERE
OIL PRICES: WHERE THEY ARE
*(14 Cities) 01/01/09-12/31/13
$0
$20
$40
$60
$80
$100
$120
Aug-14
Oct-14
Dec-14
Feb-15
Apr-15
Jun-15
Aug-15
Oct-15
Dec-15
Feb-16
Apr-16
Jun-16
Aug-16
$ per barrel (Brent)
$0
$20
$40
$60
$80
$100
$120
Jan-09
Jun-09
Nov-09
Apr-10
Sep-10
Feb-11
Jul-11
Dec-11
May-12
Oct-12
Mar-13
Aug-13
Jan-14
Jun-14
$ per barrel (Brent)