


 30 / 36

30
/
Oil: The Commodity We Love to Hate
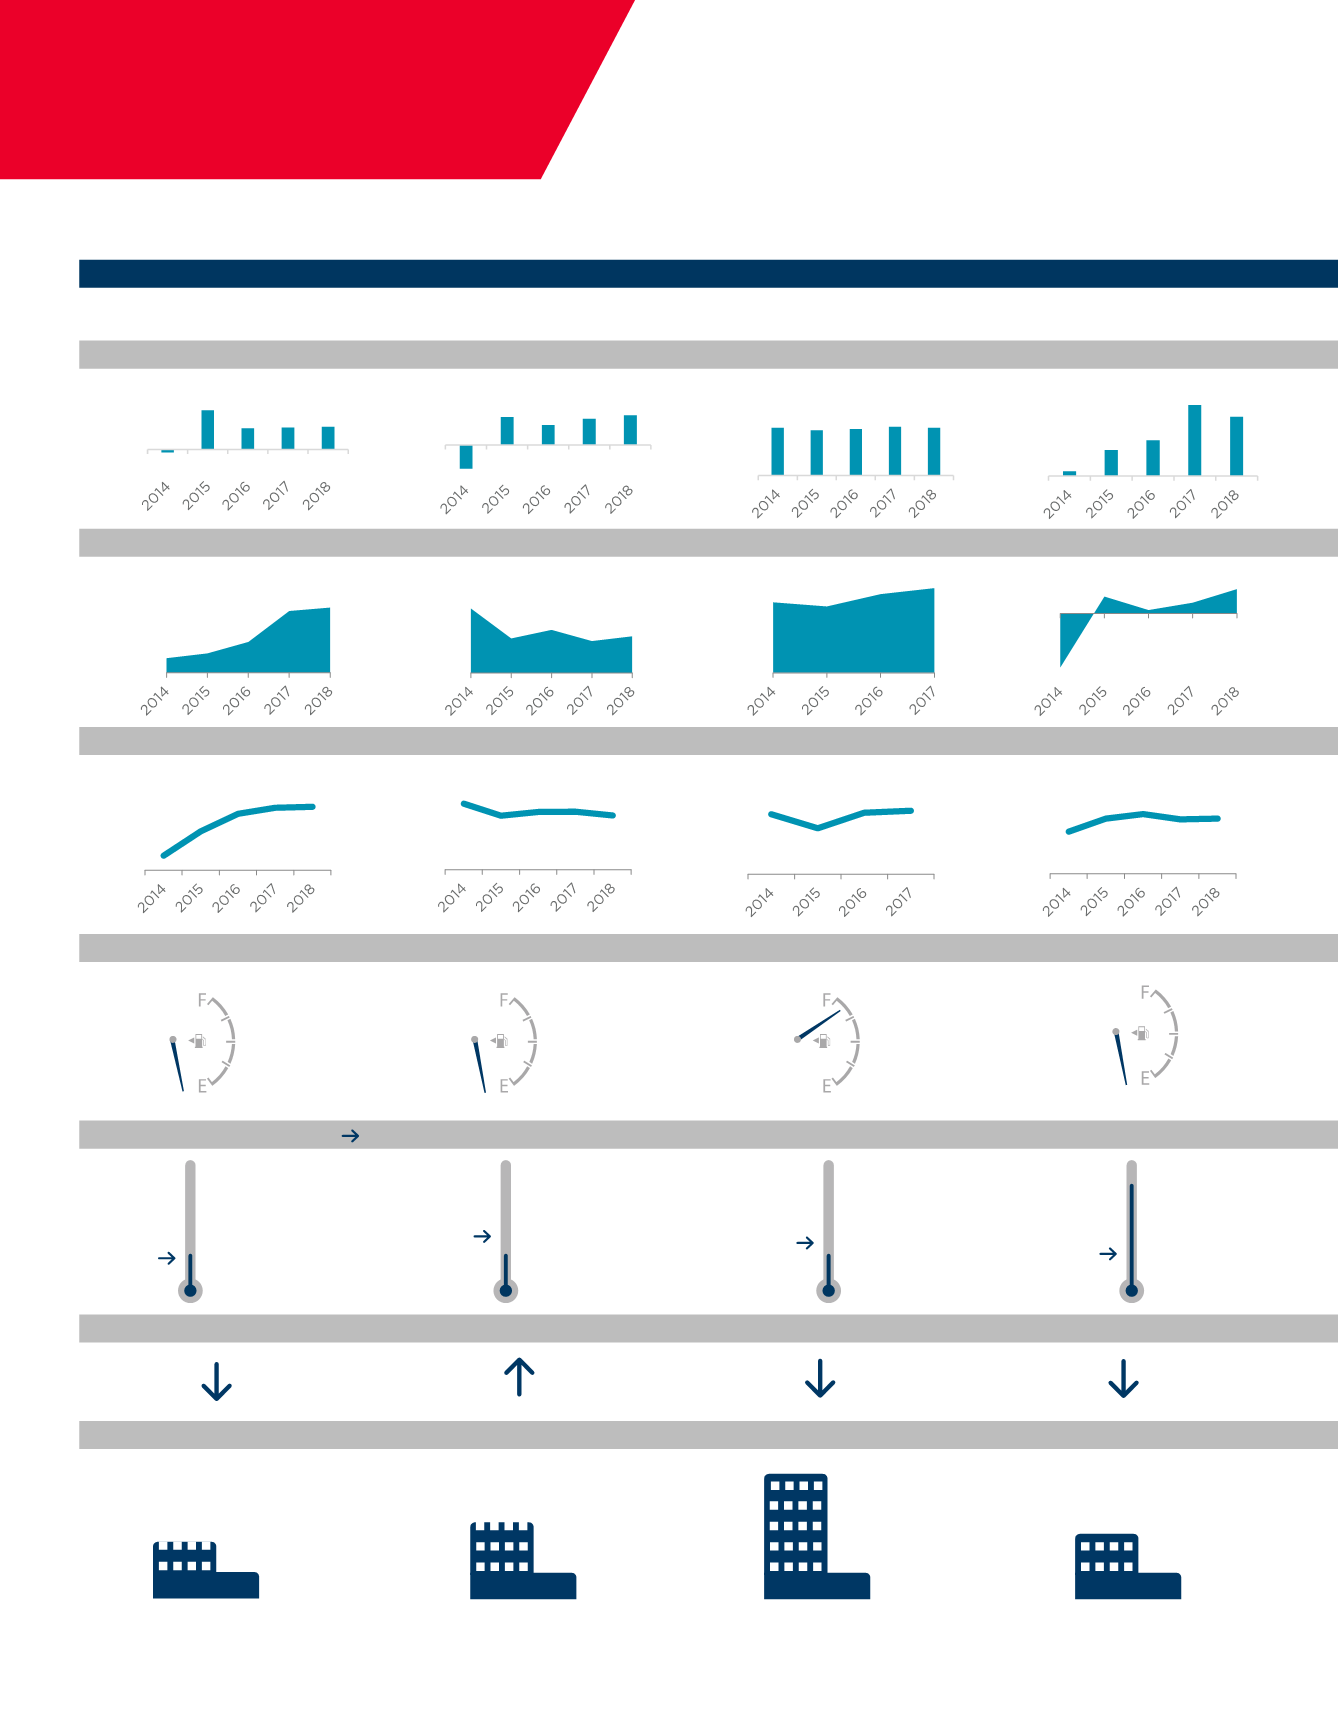
JAKARTA
KUALA LUMPUR
PERTH
MUMBAI
MARKETS
MARKET INDICATORS
Office Absorption
Landlord/Tenant (Q2 16) ( 5 year average availability ratio)
Pipeline (Completions - Q2 16 - Q4 18)
Rent Growth Forecast (Q2 16 - Q2 17)
Rent Growth (Q2 15 - Q2 16)
Office Vacancy
Job Growth
0%
5%
10%
15%
20%
0%
5%
10%
15%
20%
0%
5%
10%
15%
20%
15%
20%
25%
30%
5%
10%
Source: Oxford Economics, Cushman & Wakefield Research
21,065,300 sq ft
APAC
3,700,000 sq ft
2,268,287 sq ft
-4.4%
-5.6%
0%
5%
10%
15%
20%
-5.7%
15%
20%
25%
30%
5%
10%
15%
20%
25%
30%
5%
10%
15%
20%
25%
30%
5%
10%
1,272,300 sq ft
Note: Average availability ratio – Mumbai and Perth – 4-year average
0%
10%
20%
30%
0%
10%
20%
0%
10%
20%
30%
0%
10%
20%
30%
-100
100
300
Thousand people
-20
0
20
40
Thousand people
0
100
200
300
Thousand people
0
1,000
2,000
3,000
Thousand sq ft
0
1,000
2,000
3,000
4,000
5,000
Thousand sq ft
0
1,000
2,000
3,000
Thousand sq ft
-800
-400
0
400
Thousand sq ft
0
15
30
45
Thousand people